PSFs
PSFs in prysm have a very simple constructor,
[1]:
import numpy as np
from prysm import PSF
x = y = np.linspace(-1,1,128)
z = np.random.random((128,128))
ps = PSF(data=z, x=x, y=y)
PSFs are usually created from a Pupil instance in a model, but the constructor can be used with e.g. experimental data.
[2]:
from prysm import Pupil
ps = PSF.from_pupil(Pupil(dia=10), efl=20) # F/2
The encircled energy can be computed, for either a single point or an iterable (tuple, list, numpy array, …) of points,
[3]:
ps.encircled_energy(0.1), ps.encircled_energy([0.1, 0.2, 0.3])
[3]:
(0.015257965628937484, array([0.01525797, 0.05964335, 0.12916563]))
encircled energy is computed via the method described in V Baliga, B D Cohn, “Simplified Method For Calculating Encircled Energy,” Proc. SPIE 0892, Simulation and Modeling of Optical Systems, (9 June 1988).
The inverse can also be computed using the a nonlinear optimization routine, provided the wavelength and F/# are known to support the initial guess.
[4]:
ps.ee_radius(0.838)
[4]:
1.6266895223800204
Baliga’s method is relatively slow for large arrays, so a dictionary is kept of all computed encircled energies at ps._ee.
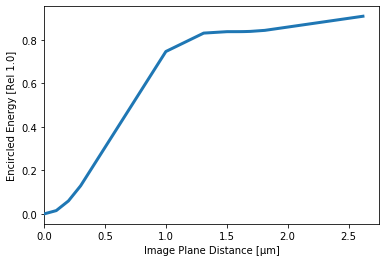
The encircled energy can be plotted. An axis limit must be provided if no encircled energy values have been computed. If some have, by default prysm will plot the computed values if no axis limit is given
[5]:
ps.plot_encircled_energy()
[5]:
(<Figure size 432x288 with 1 Axes>,
 <matplotlib.axes._subplots.AxesSubplot at 0x7f484732fd30>)
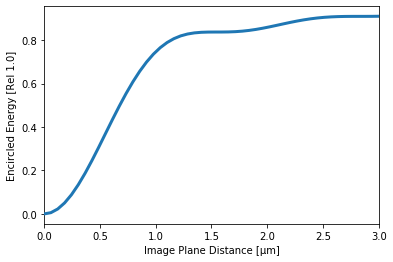
[6]:
ps.plot_encircled_energy(axlim=3, npts=50)
[6]:
(<Figure size 432x288 with 1 Axes>,
 <matplotlib.axes._subplots.AxesSubplot at 0x7f4843d42cf8>)
The PSF can be plotted in 2D,
[7]:
# ~0.838, exact value of energy contained in first airy zero
from prysm.psf import FIRST_AIRY_ENCIRCLED
ps.plot2d(xlim=5*1.22*ps.wavelength*FIRST_AIRY_ENCIRCLED,
          power=1/2,
          interpolation='lanczos',
          show_axlabels=True,
          show_colorbar=True)
[7]:
(<Figure size 432x288 with 2 Axes>,
 <matplotlib.axes._subplots.AxesSubplot at 0x7f4843d25a90>)
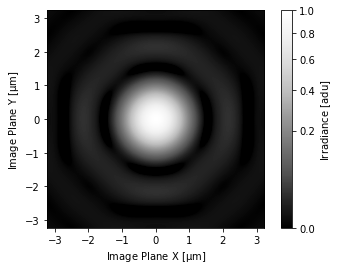
Both plot_encircled_energy and plot2d take the usual fig and ax kwargs as well. For plot2d, the axlim arg sets the x and y axis limits to symmetrical values of axlim, i.e. the limits above will be [0.8, 0.8], [0.8, 0.8]. power controls the stretch of the color scale. The image will be stretched by the 1/power power, e.g. 2 plots psf^(1/2). interpolation is passed to matplotlib. show_axlabels and show_colorbar both default to True, and control
whether the axis labels are set and if the colorbar is drawn.
PSFs are a subclass of Convolvable and inherit all methods and attributes.
