Your First Interferogram#
This tutorial will guide you through the basics of processing interferometer data with prysm. We will load a sample interferogram, mask the data, remove some low-order error, and compute basic specifications.
First we make some basic imports,
[1]:
from prysm.interferogram import Interferogram
from prysm.sample_data import sample_files
To load data, we will use a method of the Interferogram class, which takes a path to the data:
[2]:
path = sample_files('dat')
path
[2]:
PosixPath('/home/docs/checkouts/readthedocs.org/user_builds/prysm/envs/stable/lib/python3.8/site-packages/prysm/../prysm-sampledata/valid_zygo_dat_file.dat')
[3]:
interf = Interferogram.from_zygo_dat(path)
The first thing you might want to do is plot the data, which we can do with the plot2d method. There are many optional arguments to control the formatting, but the defaults are fine for now.
[4]:
interf.plot2d()
[4]:
(<Figure size 432x288 with 2 Axes>, <AxesSubplot:>)
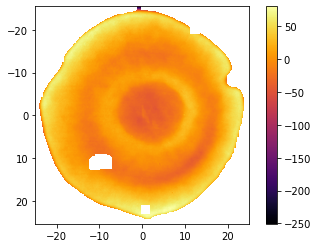
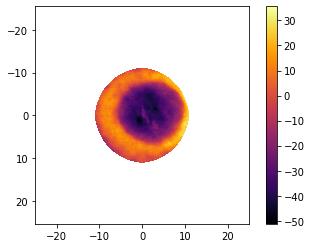
The X and Y axes have units of mm, and z nm. We can see some data dropout, and our origin is in the lower right hand corner. Let’s fix that and crop into the center 12 mm:
[5]:
from prysm.geometry import circle

interf.recenter()
interf.mask(circle(12, interf.r))
interf.plot2d()
[5]:
(<Figure size 432x288 with 2 Axes>, <AxesSubplot:>)
There’s a lot of dead space around the data, so we’ll crop that away to reduce the amount of data we have to process. The prominent interferogram routines are NaN aware so the blank space is not automatically an issue.
[6]:
interf.crop()
interf.plot2d(interpolation='bilinear')
[6]:
(<Figure size 432x288 with 2 Axes>, <AxesSubplot:>)
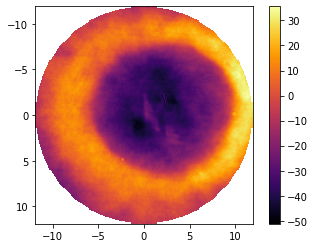
We changed the interpolation method to avoid some visual artifacts at the edges of the array. Notice that crop reset the centering of the data as a side effect. Now we’d like to remove a few low-order terms:
[7]:
interf.recenter()
interf.remove_piston()
interf.remove_tiptilt()
interf.remove_power()
interf.plot2d(interpolation='bilinear')
[7]:
(<Figure size 432x288 with 2 Axes>, <AxesSubplot:>)
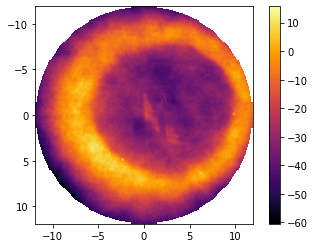
And finally we can evaluate some basic statistics,
[8]:
interf.pv, interf.rms # units are nm
[8]:
(76.20195082847296, 25.752977722290662)
You can convert these values to reciprocal waves:
[9]:
w = interf.wavelength * 1e3 # wavelength is in microns
w/interf.pv, interf.rms
[9]:
(8.304249096302488, 25.752977722290662)
So, this area of this part is \(\lambda/8\) PV and \(\lambda/14\) RMS after rounding.
In summary, to do basic interferometer data processing:
load an interferogram from disk using
Interferogram.from_zygo_datdo any cropping and masking using functions from
prysm.geometryor your own, based on thex, y, r, tattributes of the interferogram object and theinterf.maskfunction.Evaluate statistics by using the computed properties of your interferogram
We will cover more topics in the advanced tutorial.